Process Safety Leading & Lagging Indicators

Fire Risk Assessment in Chemical Plants: Identifying, Evaluating and Controlling Fire Hazards
September 7, 2026Management of Change (MOC): The Missing Link in Effective Process Safety Management
September 9, 2026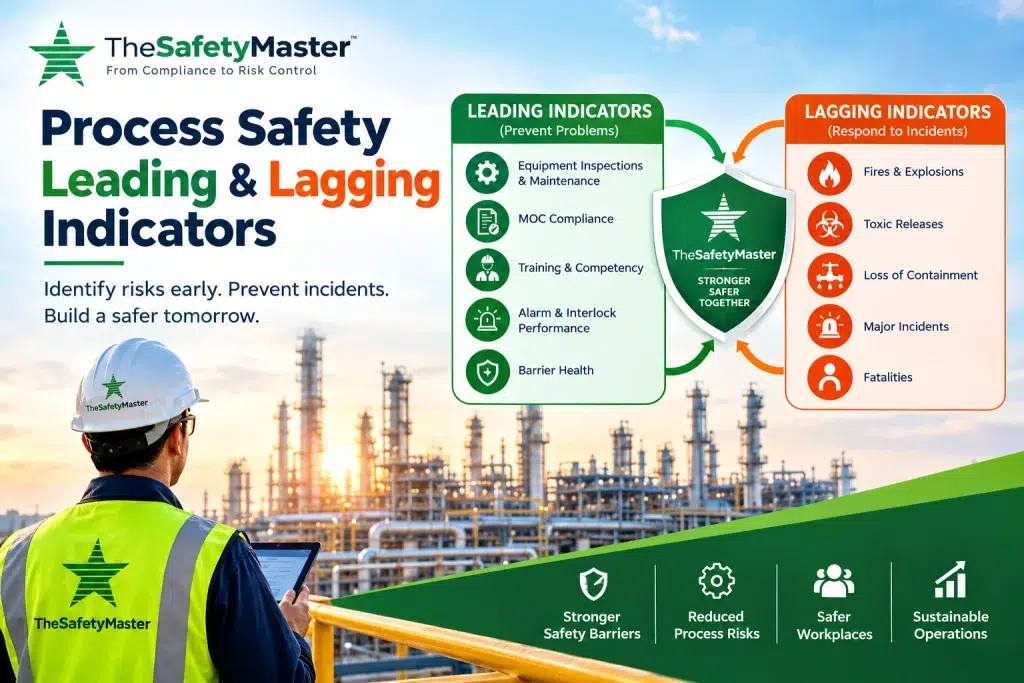
If You Only Measure Accidents, You Are Measuring Failure — Not Safety.
In high-hazard industries, safety performance cannot be understood simply by counting accidents.
A facility can report:
- Zero lost-time injuries
- Zero fatalities
- Zero recordable incidents
…and still be moving toward a major process safety event.
Why?
Because major process incidents rarely begin at the moment of the explosion, fire, or toxic release.
They usually begin much earlier.
An inspection becomes overdue.
A safety-critical alarm remains unavailable.
A temporary modification stays in place longer than planned.
A relief valve develops a problem.
A HAZOP recommendation remains open.
An interlock is repeatedly bypassed.
A corrosion finding is not corrected.
Individually, these may look like small issues.
Together, they can indicate that critical safety barriers are deteriorating.
This is why organizations need both leading and lagging process safety indicators.
What Are Process Safety Indicators?
Process safety indicators are measurable signals used to understand whether a process safety management system and its critical controls are performing effectively.
They help answer two different questions:
Lagging indicators ask:
“What has already happened?”
Leading indicators ask:
“Are our controls working well enough to prevent it from happening?”
A mature process safety system needs both.
What Are Lagging Indicators?
Lagging indicators measure events that have already occurred.
They tell us that a process safety control has failed or that an unwanted event has taken place.
Common examples include:
- Process fires
- Explosions
- Toxic releases
- Loss of containment
- Significant chemical releases
- Major equipment failures
- Process safety events
- Fatalities associated with process incidents
- Tier 1 and Tier 2 process safety events
These measurements are important because organizations need to understand their failures.
But there is a limitation.
A lagging indicator tells you that the barrier failed after the failure has occurred.
You cannot prevent yesterday’s incident.
You can only learn from it and prevent recurrence.
What Are Leading Indicators?
Leading indicators are proactive measurements.
They provide information about the health and reliability of controls before a major incident occurs.
Instead of asking:
“How many incidents did we have?”
leading indicators ask:
“Are we maintaining the conditions that prevent major incidents?”
That difference is fundamental.
Examples of Leading Process Safety Indicators
Mechanical Integrity
Mechanical integrity is one of the most important areas for leading indicators.
Possible indicators include:
- Percentage of critical equipment inspected on time
- Overdue inspection backlog
- Safety-critical equipment testing completion
- Pressure safety valve inspection compliance
- Critical equipment failure trends
- Corrosion monitoring completion
- Inspection recommendations overdue
Why Does This Matter?
A pressure vessel does not suddenly become unsafe because an inspection becomes overdue.
The problem begins when the organization allows the condition of critical equipment to become unknown or uncontrolled.
That is why inspection backlog can be an important warning signal.
Alarm and Interlock Management
Alarms and interlocks are designed to help operators and systems respond to abnormal conditions.
Leading indicators can include:
- Critical alarm availability
- Overdue alarm rationalization actions
- Safety instrumented function testing compliance
- Alarm flood frequency
- Bypass or inhibit duration
- Unauthorized overrides
- Overdue interlock testing
The Warning Sign
Imagine a critical interlock is bypassed.
Nothing happens.
The plant continues operating normally.
If you only measure incidents, you may record:
Zero incidents.
But from a process safety perspective, something important has already changed.
One of your protective barriers is no longer providing its intended protection.
That is a leading warning signal.
Management of Change — MOC
Changes are a normal part of industrial operations.
But uncontrolled changes can introduce new hazards.
Useful MOC indicators include:
- MOCs completed within the required timeframe
- Overdue MOCs
- Temporary changes exceeding approved duration
- MOC actions remaining open
- Pre-startup safety review completion
- Changes implemented without proper approval
The Hidden Risk of Temporary Changes
Temporary modifications are particularly important.
A temporary bypass may be approved for seven days.
Seven days becomes thirty.
Thirty becomes six months.
Eventually, people may forget why the bypass exists.
The equipment may continue operating with a degraded barrier.
That is exactly the type of deterioration a good leading-indicator system should expose.
HAZOP and PHA Action Closure
Hazard identification is valuable only when identified risks are actually controlled.
Leading indicators can therefore include:
- HAZOP recommendation closure
- PHA action closure
- Critical safety action overdue
- Risk-reduction action completion
- High-risk recommendation backlog
A Simple Question
Ask:
How many high-risk recommendations are still open?
Then ask:
How long have they been open?
The second question can be even more important.
An open critical action that remains unresolved for months may indicate a deteriorating risk-control environment.
Operating Discipline
Human performance is another important component of process safety.
Possible indicators include:
- Permit-to-work compliance
- LOTO verification
- Critical procedure compliance
- Operating procedure deviations
- Shift handover quality
- Safety-critical task verification
- Emergency response drill performance
The goal is not to punish employees for every deviation.
The goal is to identify whether the operating system makes safe performance reliable and repeatable.
Loss of Containment Indicators
Small leaks are often treated as minor events.
But they can provide valuable information.
Consider tracking:
- Small leaks
- Seal failures
- Flange and gasket failures
- Corrosion findings
- Pipeline integrity findings
- Repeated equipment leaks
- Temporary repairs
- Loss-of-containment near misses
Why Small Leaks Matter
A small hydrocarbon leak may not cause an incident today.
But repeated leaks can indicate:
Degrading equipment integrity → increasing loss of containment → increasing major accident potential.
Therefore, small events should not automatically be dismissed.
They can be early signals of a larger problem.
The Most Important Difference
Think about process safety like a dam.
Lagging indicator:
The dam has failed.
Leading indicators:
- Cracks are increasing
- Inspections are overdue
- Maintenance actions remain open
- Water pressure is increasing
- Monitoring systems are unavailable
Which information would you rather receive?
Obviously, the second.
Because it gives you an opportunity to act.
The same principle applies to process safety.
Zero Injuries Does Not Mean Zero Process Risk
This is one of the most important concepts in process safety.
A company can achieve:
Zero injuries
while simultaneously having:
- Overdue equipment inspections
- Increasing alarm bypasses
- Open HAZOP actions
- Poor MOC compliance
- Repeated leaks
- Weak emergency preparedness
Therefore:
Zero personal injuries cannot be used as proof that process safety risk is under control.
Personal safety and process safety are related, but they are not the same thing.
Not All Leading Indicators Are Good Indicators
Simply having more safety activities does not automatically mean better process safety.
For example:
10,000 toolbox talks ≠ strong process safety
100% training completion ≠ effective safety barriers
More safety observations ≠ lower major accident risk
Zero injuries ≠ zero process safety risk
A useful indicator must be connected to a real hazard, critical control, or safety barrier.
The most important question is:
“Which major accident scenario does this indicator help us control?”
If there is no clear connection, the indicator may not be useful.
Build a Risk-Based Process Safety Dashboard
A good dashboard should not contain dozens of unrelated statistics.
It should provide management with visibility into the health of important risk controls.
A useful process safety performance chain can look like this:
Hazard Identification
↓
Risk Assessment
↓
Critical Controls
↓
Mechanical Integrity
↓
Management of Change
↓
Operating Discipline
↓
Alarm & Interlock Performance
↓
Emergency Preparedness
↓
Process Safety Event
The objective is to identify deterioration before it reaches the final stage.
One Critical Concept: Barrier Health
For high-hazard facilities, one of the strongest approaches is to monitor critical barrier health.
Consider this scenario:
Flammable chemical release
↓
Vapour cloud formation
↓
Ignition
↓
Fire or explosion
Several barriers may exist between the initial release and the final consequence:
- Equipment integrity
- Leak detection
- Ventilation
- Gas detection
- Ignition source control
- Emergency shutdown
- Fire protection
- Operator response
The question should not only be:
“Did an accident occur?”
The better question is:
“Are our critical barriers available, effective and maintained?”
That is where leading indicators become extremely valuable.
How Leading and Lagging Indicators Work Together
Leading and lagging indicators should not compete with each other.
They should work together.
Leading indicators tell you:
What could happen?
Lagging indicators tell you:
What happened?
Together they tell you:
How effectively are we controlling process safety risk?
For example:
| Leading Indicator | Lagging Indicator |
|---|---|
| Overdue PSV inspections | Loss of containment |
| Interlock bypass duration | Process safety event |
| Open HAZOP actions | Fire or explosion |
| Overdue MOCs | Unplanned shutdown |
| Corrosion findings | Equipment failure |
| Alarm unavailability | Process incident |
This combination provides a much stronger picture than incident statistics alone.
What Should Management Look For?
Management should not simply ask:
“Are our numbers green?”
They should ask deeper questions.
Are critical barriers healthy?
Are overdue actions increasing?
Are small failures becoming more frequent?
Are temporary modifications becoming permanent?
Are critical alarms and interlocks available?
Are safety-critical inspections being completed?
Are HAZOP and PHA recommendations being closed?
Are repeated leaks occurring in the same equipment?
These questions move process safety from measurement to risk control.
Common Mistakes in Process Safety Measurement
Focusing Only on Accident Frequency
Traditional safety statistics can create a false sense of security when used alone.
Measuring Activity Instead of Risk
Counting meetings, training hours, or toolbox talks does not necessarily show whether major accident risk is being controlled.
Having Too Many Indicators
A dashboard with 100 metrics can make it difficult to identify the indicators that actually matter.
Ignoring Deterioration Trends
One overdue inspection may not be alarming.
But an increasing inspection backlog over six months is a different story.
Failing to Act on Indicators
An indicator has little value if nobody investigates poor performance or takes corrective action.
A Better Question for Process Safety Leaders
Instead of asking:
“How many incidents did we have?”
ask:
“Where are our safety barriers becoming weaker?”
Then ask:
“What are we doing about it?”
That is a much more mature approach to process safety management.
The Safety Master View
At The Safety Master (TSM), we believe process safety performance should not be measured only by the absence of incidents.
The real objective is to understand whether critical risk controls are present, available, effective, and continuously maintained.
A strong process safety system combines:
- Leading indicators
- Lagging indicators
- HAZOP
- HIRA/PHA
- Mechanical integrity
- Management of Change
- Safety audits
- Operating discipline
- Emergency preparedness
- Critical barrier management
“Are we controlling the risks that could cause a major incident?”
The best process safety indicator is not the one that tells you an incident happened.
It is the one that gives you enough warning to prevent the incident from happening.
The Safety Master (TSM)